For people learning to read charts
Any trading chart, explained in plain English
Upload a screenshot of any chart. ChartNox explains the trend, the key levels and the price that would prove the read wrong.
- Free to try, no card
- Not signals
- We don’t keep your screenshot
Free account: 1 full readout a day. Pro $39/month after a 3-day free trial (card needed, cancel any time). See Pro. By analyzing you agree to our Terms.
Tip: crop out your name and account balance. We only need the chart.
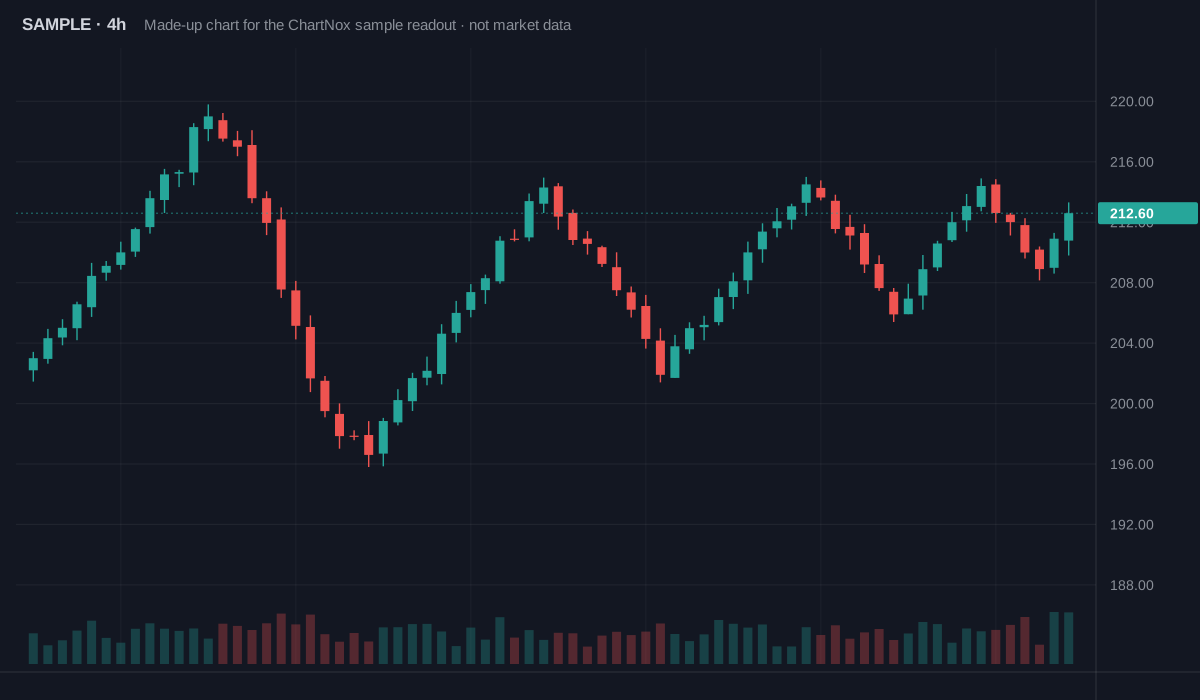
Example readout of a 4-hour sample chart. Trend: bullish, higher lows. Key levels: resistance 214.00 to 215.00, support 208.00. Wrong if: a 4-hour close below 208.00. Overall: neutral, wait for a break. Price is making higher lows into a flat ceiling at 214–215. The lean is bullish while 208 holds, but there’s no clean break above 215 yet, so the read stays neutral.
How it works
What’s AI, and what’s code
So you always know what to double-check.
The read · AI
Trend, levels, and where it’s wrong
Written by AI from your chart image only. It can misread, so compare it with yours.
- Daily trend UptrendWeekly trend Uptrend1-year range
Example · from real daily and weekly prices
The bigger picture · Code
Real prices beside the read
Trend, 1-year range and key zones, calculated from real daily and weekly prices.
Compare Free and Pro - 97%of 2,982 trades matched open-source backtesting.py exactly (99% with the same exit rule)
Backtests · Code
Numbers you can check
Every trade listed, losing ones too. Results are hypothetical.
How we checked
More than a read
Check an idea before you trust it
Example
Backtester · Code
Test an idea on past prices
See every trade a rule would have taken, with a research report. No coding.
Free 2 a day · Pro 30
Open the backtesterRule: RSI(14) below 30 · 1D
ADAMatchesDOTMatchesLINKMatchesExample
Screener · Code
See which markets match a rule
One rule across crypto, stocks, forex or indices. Listed A to Z, never ranked.
Free 3 a day · Pro 30
Open the screenerWhy is 208 the level that breaks this read?
It’s the last higher low. A close below it ends the higher-low pattern, so the bullish read no longer holds.
ChartNox AI tutor
Ask why, in plain words
A patient teacher for any chart question. On Pro it can run a backtest or scan for you.
Basic 20 a month · Pro 40 a day
See what Pro adds- NecklineBottom 1Bottom 2Breakout
Illustrative example drawn by ChartNox: not real market data and not a trade signal. Patterns
53 chart patterns, explained
What each looks like, how to spot it and when it fails, with a one-page cheat sheet.
Guides free · 4 in the app on Free, all on Pro
Browse patterns
ChartNox Pro
Everything, every day
$39 a month, about $1.30 a day, billed monthly. Try it free for 3 days first.
| Feature | Free | Pro |
|---|---|---|
| Chart reads a day | 1 | 10 deep reads |
| Chart patterns in the app | 4 open | All 53, plus shape match |
| ChartNox AI tutor | Not included | 40 messages a day; runs backtests and scans for you |
| Backtests a day | 2 | 30, with AI explanations and the AI rule builder |
| Market scans a day | 3 | 30 |
| Bigger picture beside your read | One line | Full: trend, change, range, key zones |
| Advanced analysis lens | Not included | Included |
| Analyze straight from Live Charts | Not included | Included |
Yearly: $374 for Pro (over 2 months free). Basic: $9/month for 3 reads a day, 20 tutor messages a month and 22 patterns. Prices in USD; tax is included or added at checkout, depending on your country. Compare all plans
Not ready yet?
Free tools, no sign-up
Calculators · Code
4 trading calculators
Position size, risk/reward, pip value and Fibonacci levels.
Open calculatorsCheat sheet
All 53 patterns on one page
What each looks like, reversal or continuation, and how to spot it.
Open the cheat sheetPractice
Daily chart challenge
One short puzzle a day on real past charts, plus a quick trader quiz.
Play today’s chartBots · AI
Telegram and Discord bot
Send a chart in your group and get a short plain-English read.
No surprises
Straight answers
Still unsure? Contact us or compare plans.
What ChartNox can’t do
- Predict where price goes next
- See anything outside your screenshot
- Promise it’s right: we don’t claim an accuracy rate
What we never do
- Buy or sell calls, or signals
- Win-rate or profit claims, or countdown timers
- Fake reviews (we’re new, so there are none yet)
Is ChartNox a signal service?
No. ChartNox is educational software for learning to read charts. It does not give investment advice, trading signals or buy/sell calls, and it doesn't sell strategies. Readouts show reference levels read from the chart for study, not orders. You make your own decisions.
How accurate is it?
We don’t measure or claim an accuracy rate, and ChartNox doesn’t predict prices. Readouts are written to a fixed framework about what is visible on the chart: trend, levels and the price where the read would be wrong. AI can misread a chart, mix up numbers or simply be wrong, and no person checks a readout before you see it, so compare it with the chart yourself.
What does the AI see, and what is done in code?
The AI reads only your screenshot and writes the readout. Everything else is plain code on real market data: when we can identify the market, the live price and the bigger picture beside the read (trend on daily and weekly candles, 1, 3 and 12-month change, 1-year range and support and resistance zones), the backtester and the screener. Code results don’t change the AI read.
What happens when the trial ends?
A payment method is needed to start the 3-day free trial, one per person. We email you before it ends. If you don’t cancel before the end, it becomes Pro at $39/month (or the yearly price you picked) and renews until you cancel.
How do I cancel or get a refund?
Cancel online any time in Settings, on our Cancel page (no login needed) or through Paddle, our Merchant of Record. If ChartNox isn’t for you, you can get a full refund within 14 days of your first payment (once per person, first payment only). Details are on the Refund page.
Why not just paste my chart into ChatGPT?
You can. ChartNox adds a fixed readout format built for chart reading, the levels it found drawn on your chart, the market’s bigger picture from real prices, and backtests and scans that run in code rather than AI.
What happens to my chart image?
It is sent to our AI provider to be read and is not kept by us after the analysis. Under its published API policy, our provider doesn’t use it to train its models. Crop out names, balances and account numbers before you upload. Details are in our Privacy policy.
What charts work?
Any chart screenshot: TradingView, Binance, Bybit, MetaTrader, Thinkorswim, Webull and others, for crypto, stocks, forex or indices. A clear, uncropped chart reads best.
I’m new to charts. Can I still use it?
Yes. Readouts explain the trend, the levels that matter and what would prove the read wrong in plain English, for learning, not as trade instructions. The pattern guides, cheat sheet and calculators are free too.
What’s free?
Without an account you can try 1 analysis a day. A free account gets 1 full readout a day and 4 open patterns in the library, with no card. The calculators, pattern guides, cheat sheet and daily chart challenge are free for everyone.
Readouts show reference levels for study, not orders. Trading carries a high risk of losing money; ChartNox is an educational tool and does not give investment advice.